
 Español
 Deutsch
 Français
 Русский
 Български
 Čeština
 Dansk
Dansk
 Gaeilge
 Hrvatski
 Italiano
 Nederlands
 Polski
 Português
 Română
 Српски
 Slovenčina
 Slovenščina
 Svenska
 Українська

Part 1 — Open property details
Every listing in SpeakDot Estate can be compared with similar active properties from across the market.
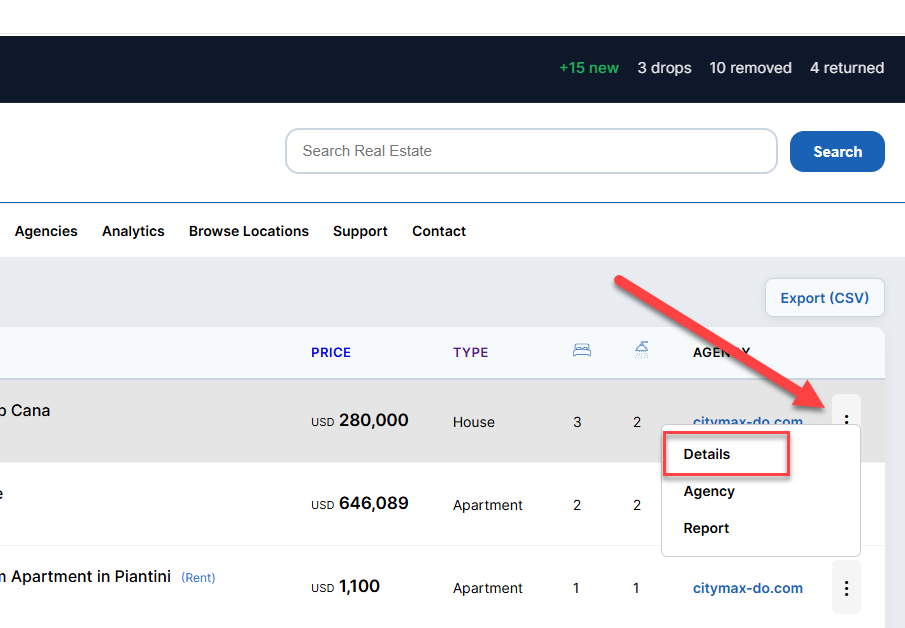
The system analyzes similar properties based on available market data, including:
- location
- property type
- price range
- number of bedrooms
- other available characteristics
Part 2 — View Similar Listings
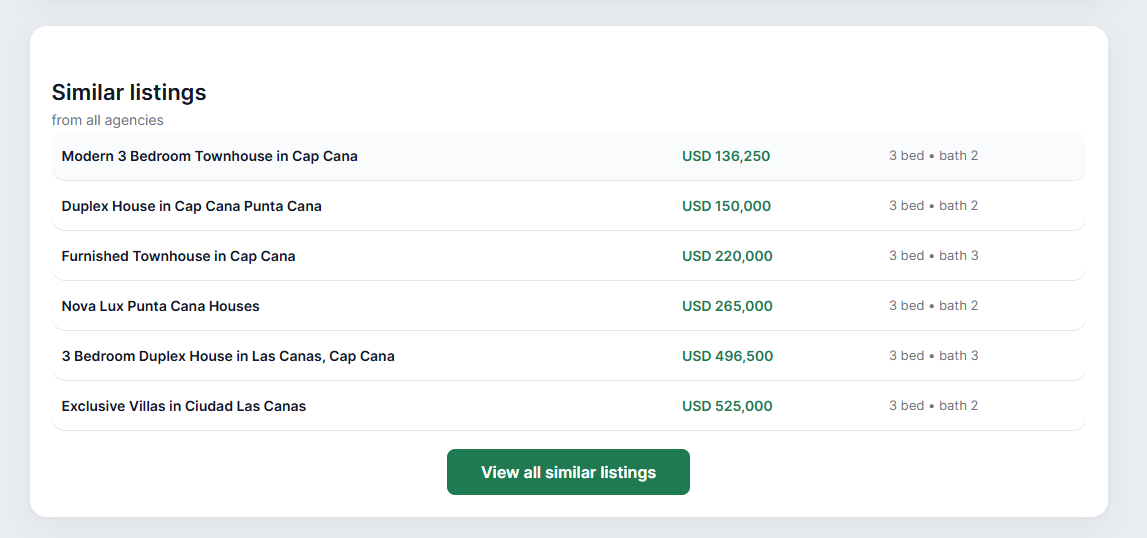
You can review:
- similar properties currently available
- their asking prices
- different agencies offering comparable properties
- the amount of competition in the same market segment
Part 3 — Understand Price Position vs Market
This section is different from the median view. The median shows only a single reference point in the market — the middle price. This view looks at the entire market range instead, from the lowest to the highest prices among similar listings. It shows where the property sits within that full range and how it is positioned compared to all other homes, not just the middle value.
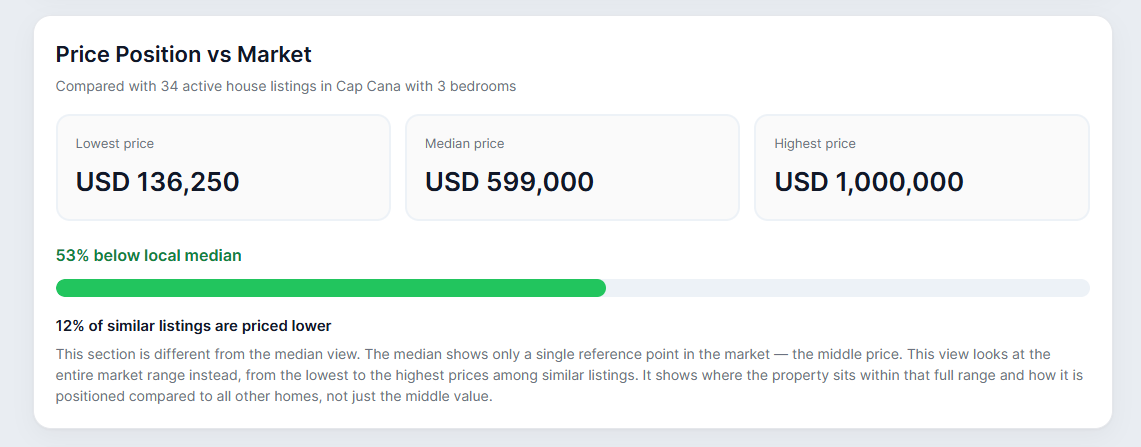
It helps answer questions such as:
- Is this property priced above the market?
- Is it within the typical price range?
- Is it positioned below similar properties?
The position is calculated using comparable listings available in the same market segment.
Part 4 — Compare Price Ranges
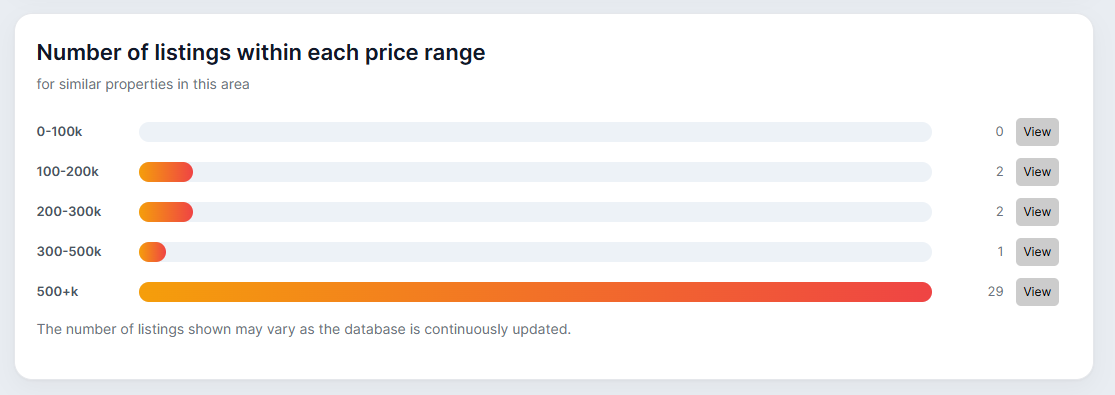
This helps identify where most competing listings are concentrated.
For example, you can see whether most similar villas are listed below, around, or above the current asking price.
Part 5 — Price compared to similar active listings
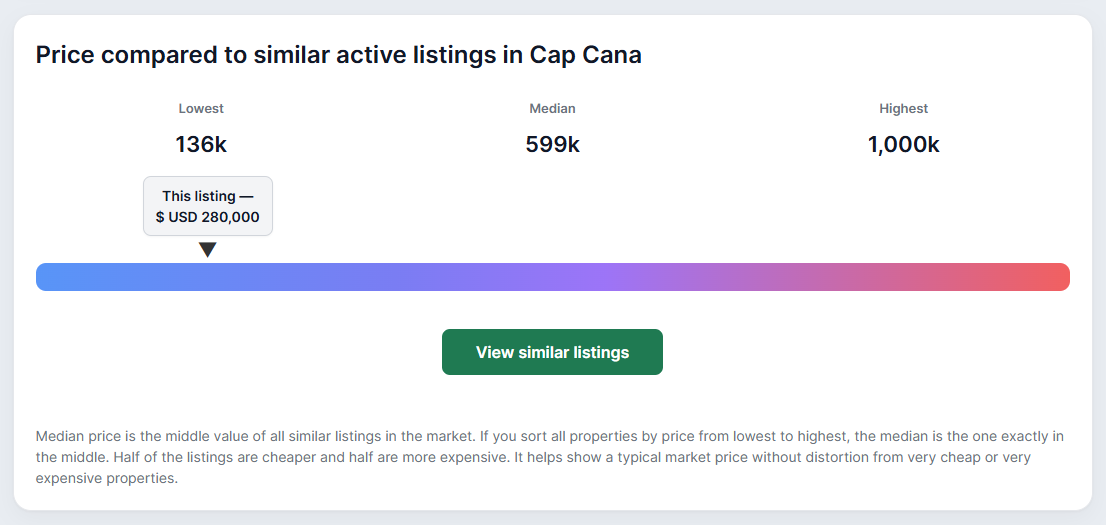
If you sort all properties by price from lowest to highest, the median is the one exactly in the middle. Half of the listings are cheaper and half are more expensive. It helps show a typical market price without distortion from very cheap or very expensive properties.
Part 6 — The most active agencies in the area
The Most Active Agencies in the Area section shows which agencies currently have the largest number of active listings for the same property type in the selected area.
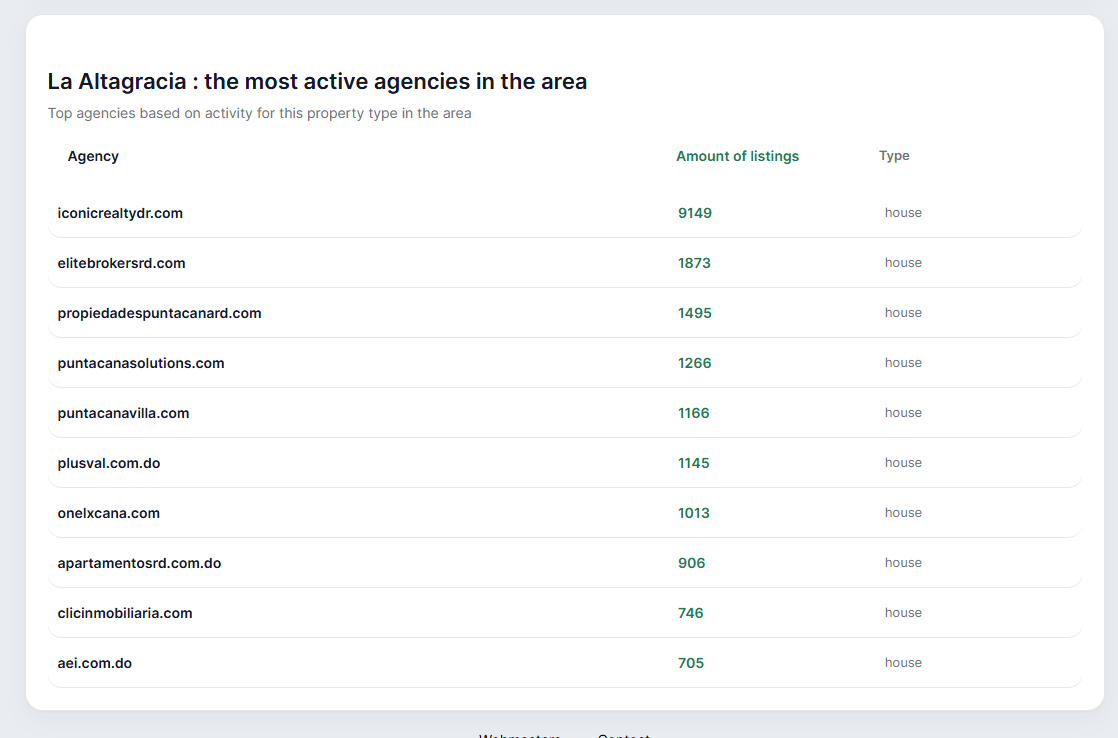
Each agency name is a clickable link that opens its analytics page, where you can explore additional information about the agency.
- current active listings
- historical listing growth
- property type distribution
- price distribution
- listing stability and removal trends
- 90-day activity analysis
Part 7 — Example use cases
For Agents
- Prepare a pricing discussion with a seller.
- Create a comparative market analysis (CMA).
- Evaluate competing listings in the same area.
For Buyers
- Compare similar properties from multiple agencies.
- Understand whether the asking price is competitive.
- Discover alternative listings within the same market segment.